Sooo Do You Actually Know Your Numbers?
(Like, if you are actually profitable?)
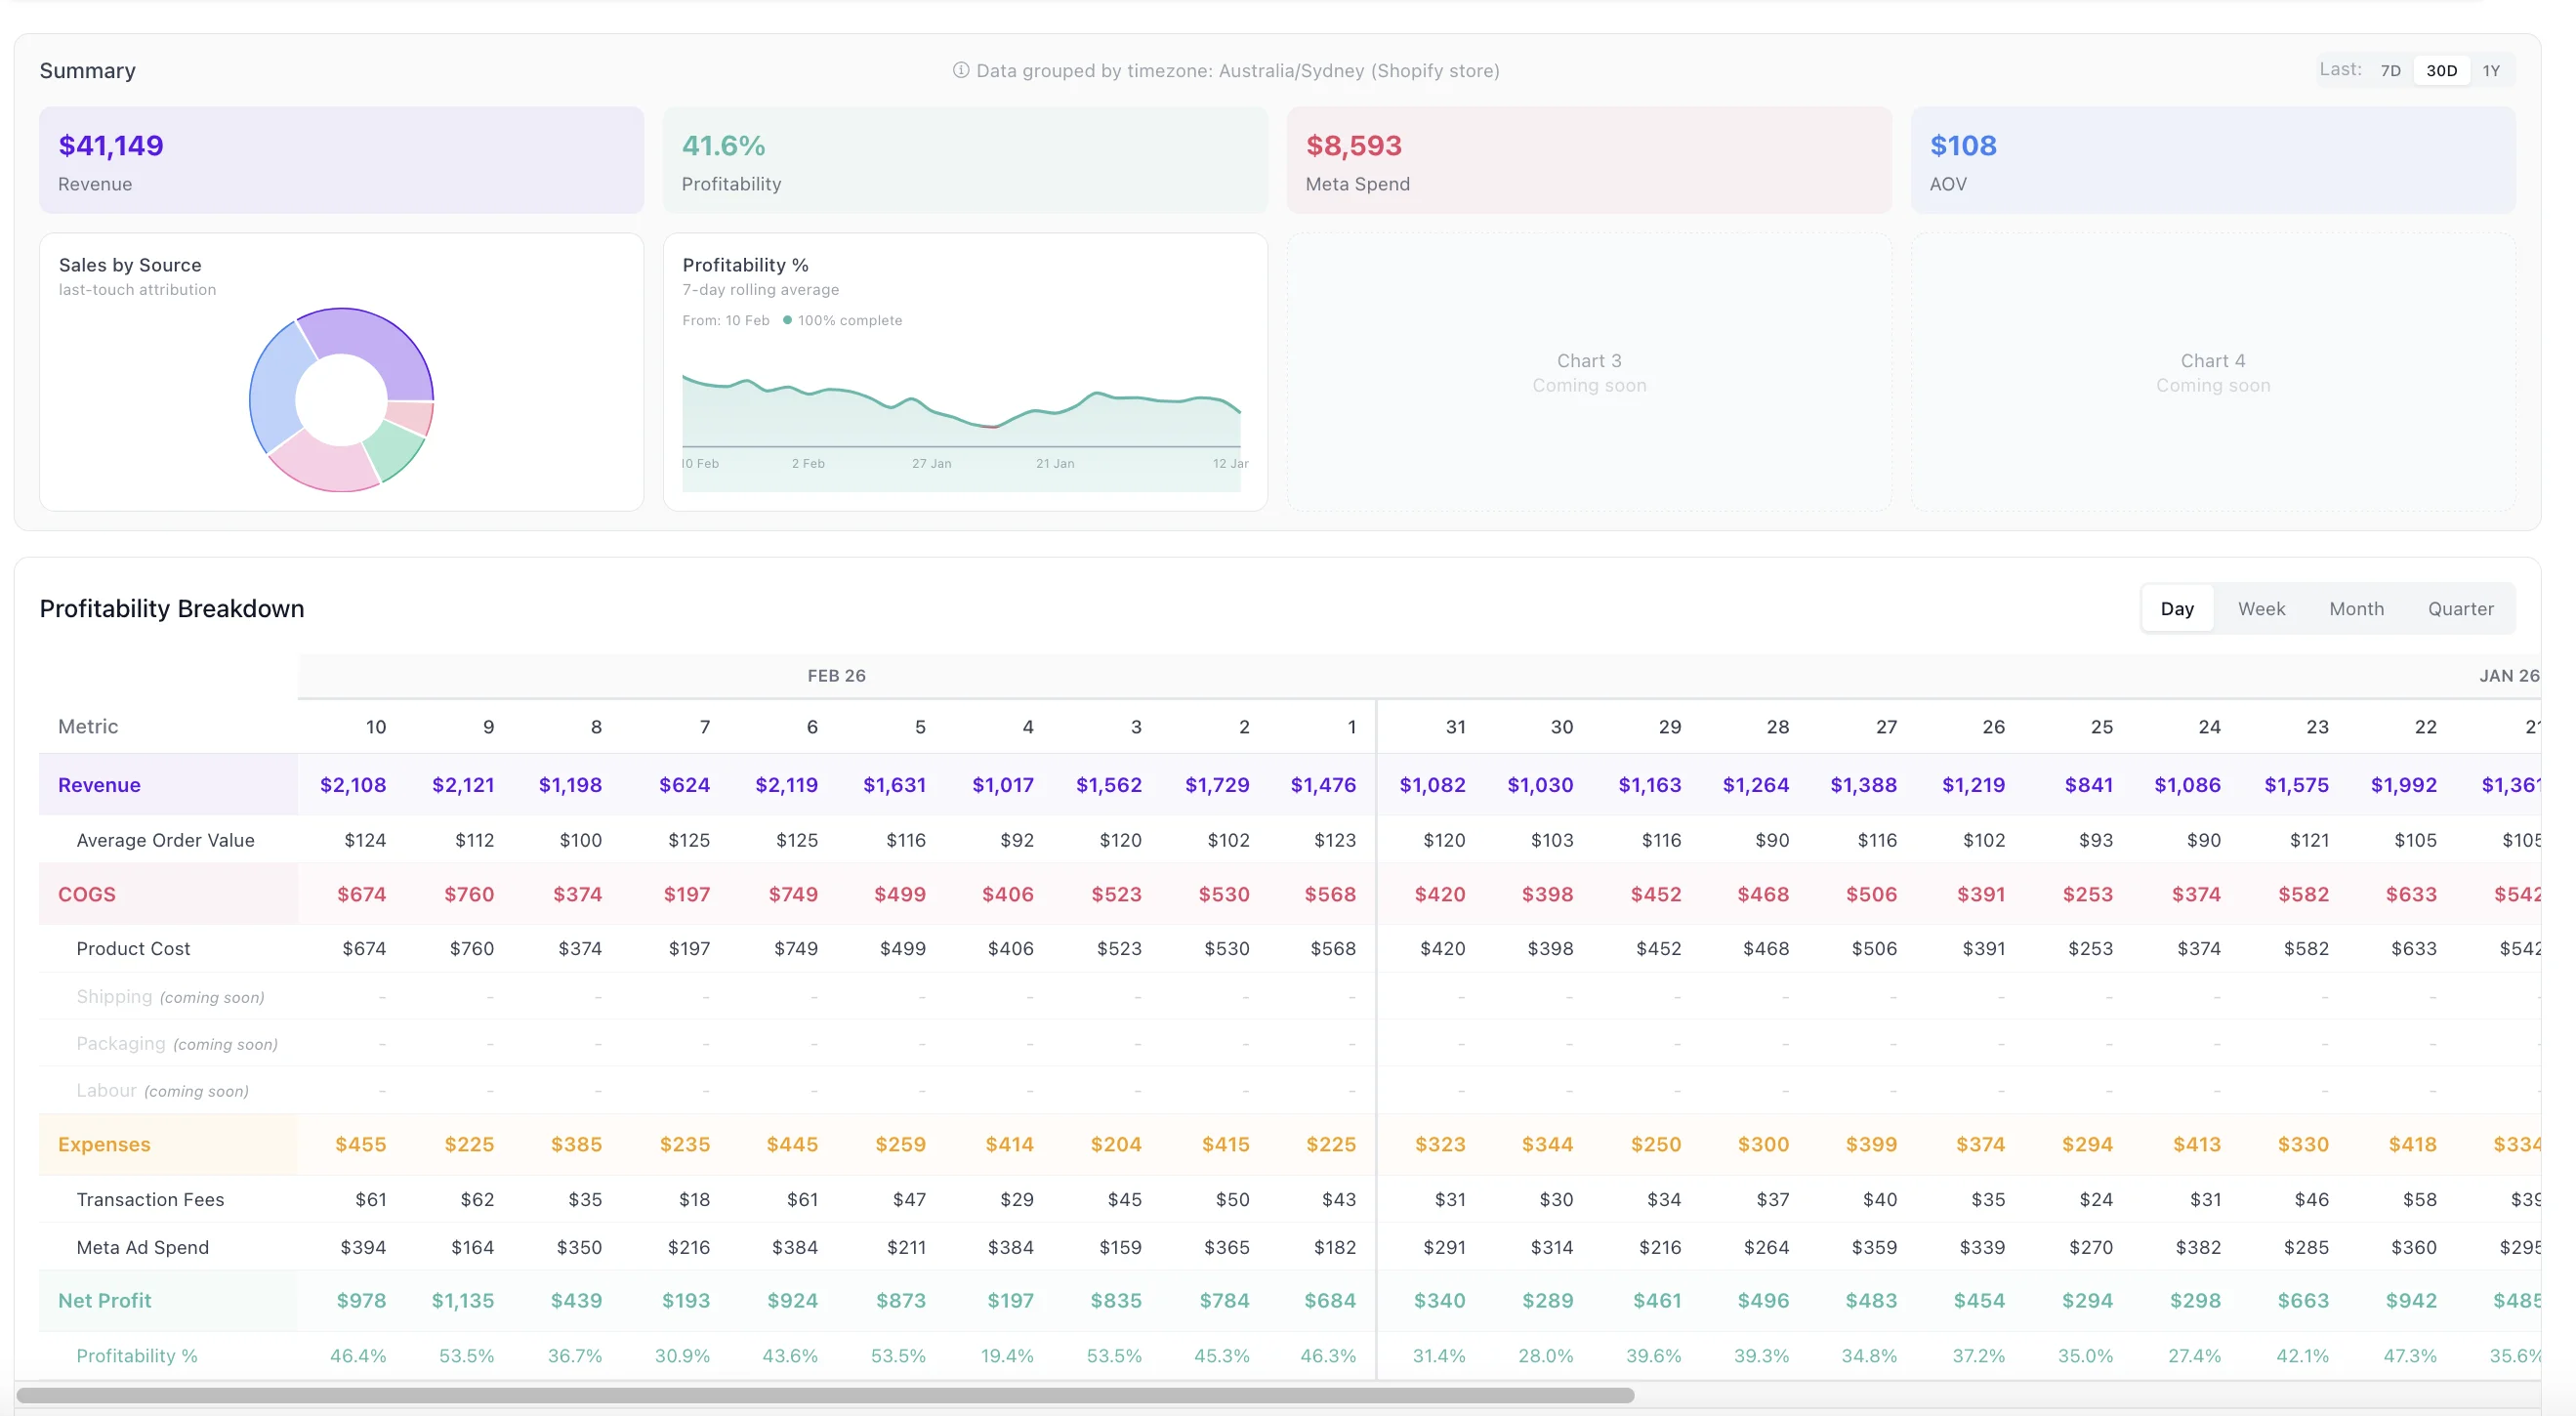
Shopify tells you what you sold. Meta tells you what you spent. Neither tells you if you're making profit or loss.
SoMe bridges the gap between your dashboards giving you the real-time profit clarity you need to scale without the anxiety.
The "Aha" Moment: Your Real Contribution Margin
Most founders are surprised when they see their true numbers for the first time. We pull in:
The "Actual" COGS
Not just the base price, but the landing costs and transaction fees that eat your margin.
The Meta Ads Check
We map ad spend against profit, not "estimated" revenue, so you know exactly which campaigns are bringing in the money.
The Safe-to-Spend Limit
A daily profit percentage that tells you exactly how much you can reinvest today.
Most founders have leaks but don't even know where.
Scaling a leaky bucket is the fastest way to go out of business. We highlight the numbers that Shopify doesn't tell you:
What You Get Inside
For $30/month, you get ongoing access to:
| JUL | JUN | |||
|---|---|---|---|---|
| Metric | 12-18 | 5-11 | 28-4 | 21-27 |
| Revenue | $24,800 | $16,200 | $22,400 | $19,800 |
| Average Order Value | $58 | $45 | $56 | $51 |
| COGS | $8,270 | $5,400 | $7,470 | $6,600 |
| Product Cost | $8,270 | $5,400 | $7,470 | $6,600 |
| Shipping(coming soon) | - | - | - | - |
| Packaging(coming soon) | - | - | - | - |
| Labour(coming soon) | - | - | - | - |
| Expenses | $4,960 | $12,960 | $5,380 | $8,910 |
| Transaction Fees | $740 | $490 | $670 | $590 |
| Meta Ad Spend | $4,220 | $12,470 | $4,710 | $8,320 |
| Net Profit | $11,570 | -$2,160 | $9,550 | $4,290 |
| Profitability % | 46.7% | -13.3% | 42.6% | 21.7% |
Profitability Tracking
- Track daily profitability with rolling averages
- See where your money is going (COGS, expenses, ads)
- Identify profitable vs unprofitable periods
- Make data-backed decisions on ad spend
- Get notified when your profitability goes into negative territory
Know exactly how profitable you are, every single day.
Shopify Data
- Best-selling products
- Profit percentages
- Inventory forecasts
- Revenue and growth trends
- AOV insights
- How traffic is coming to your website and how to double down
All through clean, easy to read graphs and charts.
 Partner


Meta Ads Data
- Which ads are performing (and which aren't)
- Metrics that actually matter to help you scale
- Spend vs return insights
 Tech Provider
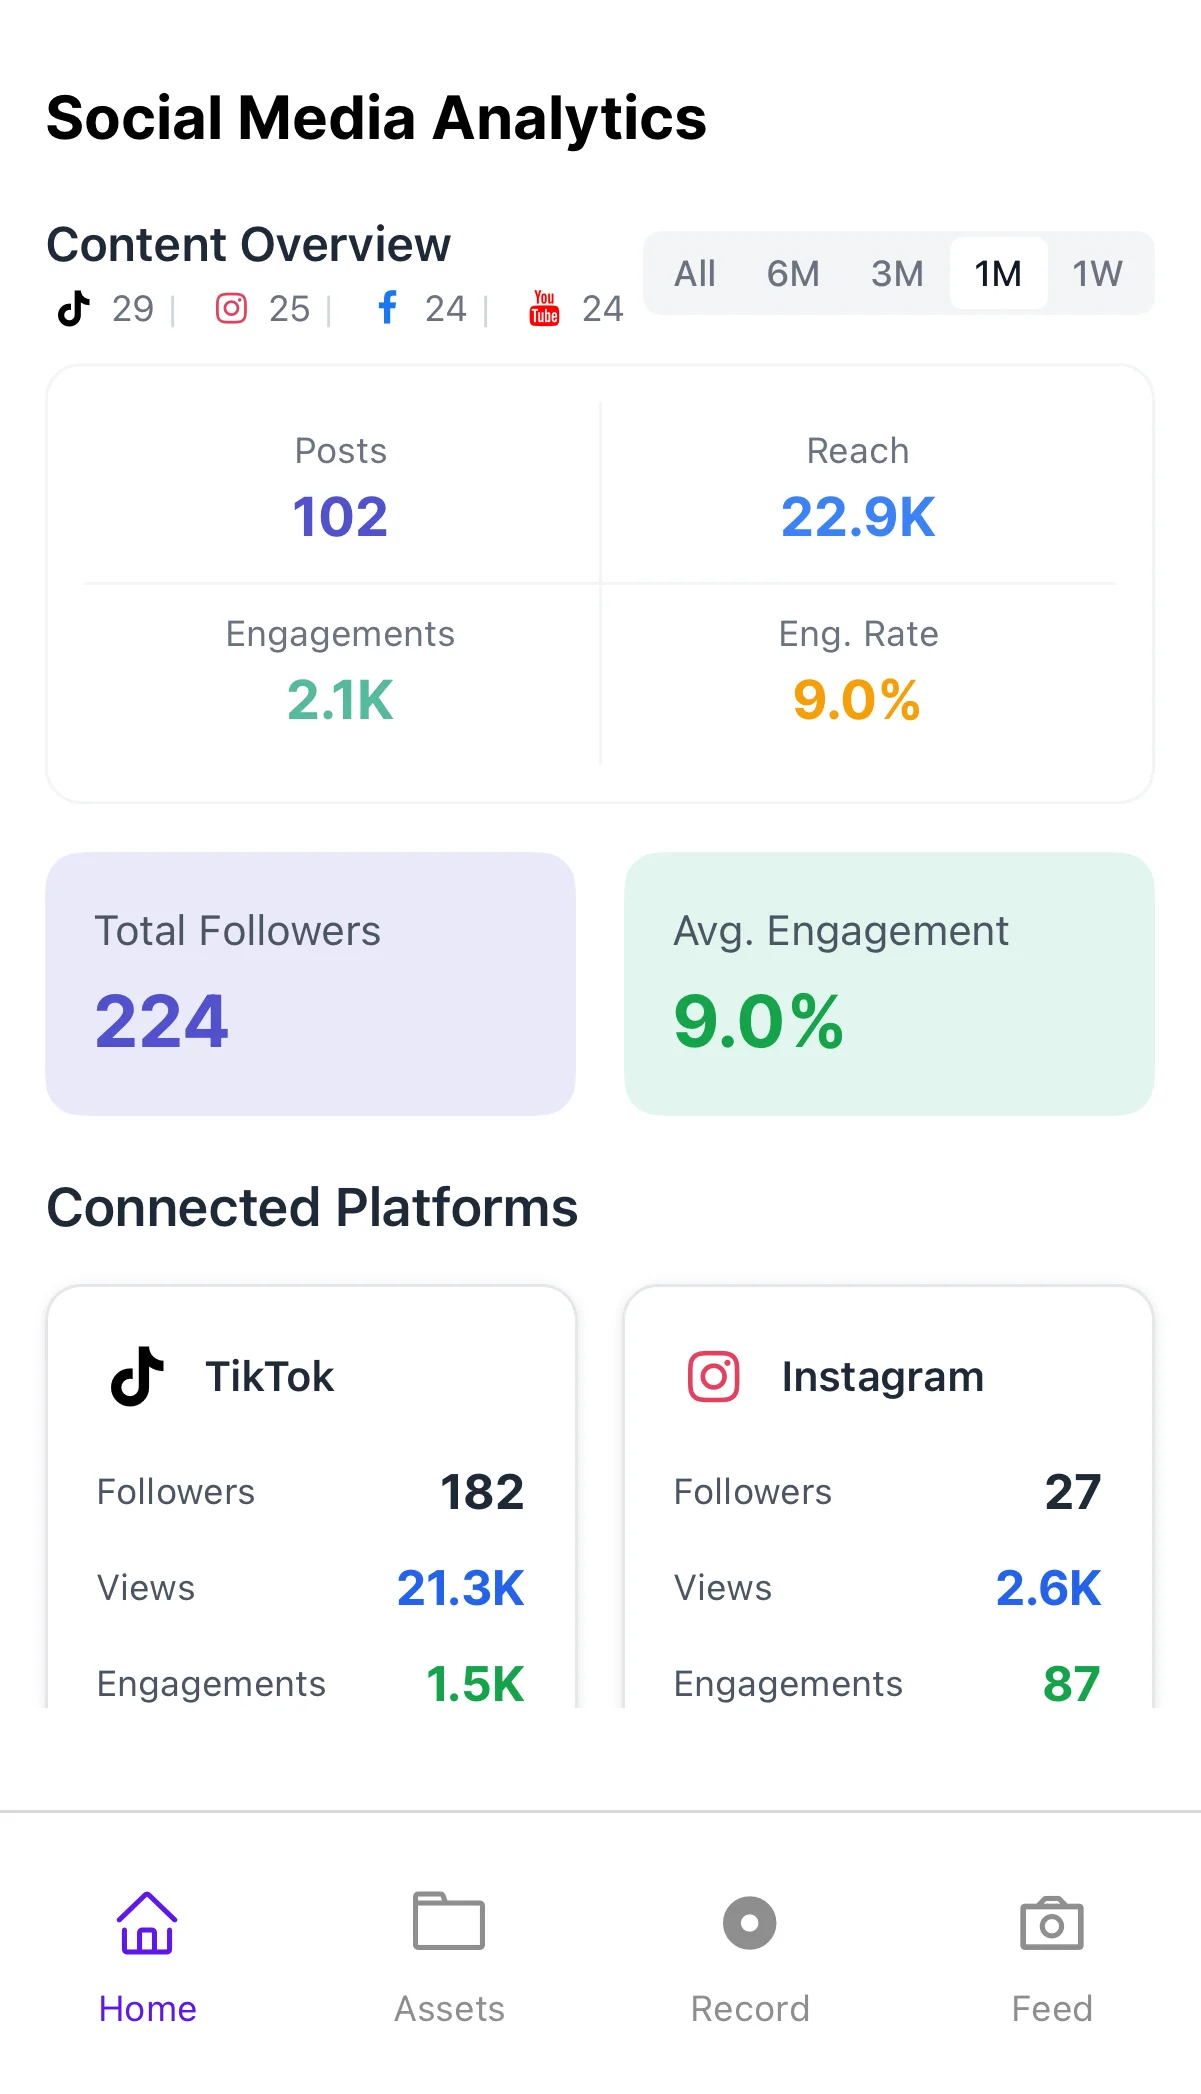
Organic Social Media Data
- See your top-performing posts
- Reply to comments directly from SoMe
- Retention rates
- Converting patterns you can replicate
What's actually working organically in ecom.
Who This Is For
This is for you if:
Why This Works
Most marketing advice is:
- ✕Outdated
- ✕Theoretical
- ✕Based on "what used to work"
This gives you:
- Live data
- How your brand is tracking (without outdated spreadsheets)
- Real insights into your organic, meta ads and shopify data all in the same dashboard
Instead of asking “Will this work?”
You start asking “How can I adapt what's already working?”
That's how brands scale - faster and smarter.
The Investment
Aka Less than:
Get Instant Access
Stop guessing.
Double down and start scaling with data.