 SoMe Stories & Insights
Does posting to LinkedIn more than once a day damage my reach?
 Sofia KetteFounder of SoMe, AdelaideLinkedIn
It is a very commonly held belief that posting more than once a day on LinkedIn destroys the performance of the posts for that day. So I decided to test it out - with statistics!
Here I will overshare my own analytics and go through impressions and engagements.
Then I will go through what other creators have done and see what they have there using their engagements data.
Some people claim that it drops impressions on other posts by 2x, so you are essentially halving your reach. (disclaimer I can only see my own impressions)
Methods and assumptions
I downloaded my data from the past 6 months through Linkedins analytics tools. This includes things like the number of shares, follows, impressions, comments etc. This data is current as of the 16th of November.
Filtering:
- I removed any posts less than 7 days old (Linkedin can take a little while to push content out)
- I removed anything older than 5 months old.
I have not been posting actively on Linkedin for that long, so some months are much more sparse than others.
Engagement means reactions + comments + reposts (things we can see publicly)
The data has to be normalised using a Log scale.
How this was done:
- I divided the posts into 2 groups: 1 post per day (49 posts) and 2+ posts per day (58 posts)
- I normalised the data with a natural log
- I checked the statistical assumptions (more hidden below if you are interested)
- I cleaned the data
- I ran the proper statistical tests
On my own data I ran this for both impressions and engagements. The engagements are so we can compare my data with others data later on.
What is a Log Scale? A log scale is important in data analytics as it 'normalises' data -> as you can see in the left post below some posts get a lot of impressions whereas a lot get not that many. Therefore the axis of all the posts here are a factor of 10. So 10, 100, 1,000 etc. instead of by 1, 2, 3. Our data is normalised using a natural log (e).
![[linkedin-posting-frequency/why_log_scale.png]]
For the stats nerds like me ❤️ (cause you can't trust AI with these things) ~ Assumptions
***** DISCLAIMER ***** This section assumes you know statistics - you might find it hard to follow along if you do not know statistics.
Step 1. Hypotheses
Firstly we set up the hypotheses for the experiment. We use a 5% level of significance and we ran two different tests. The first on impressions, the second on engagement (sum of public statistics).
- H0 (null hypothesis): Posting once or 2+ times a day has no impact on impressions.
- H1: Posting more than once a day causes lower impressions
- We do a one sided test
- α = 0.05.
- H0 (null hypothesis): Posting once or 2+ times a day has no impact on engagement.
- H1: Posting more than once a day causes lower engagement.
- We do a one sided test
- α = 0.05.
Step 2. Check the assumptions
We are using Welch's two-sample t-test, so we have to check three assumptions. A) Normality, B) Spread and C) Independence.
If Normality does not hold, we can use Mann-Whitney's U test, where the assumptions are A) Spread B) Independence.
We also check outliers.
2a. Normality
The normality of the data tells us if we can use Welch's t-test or not.
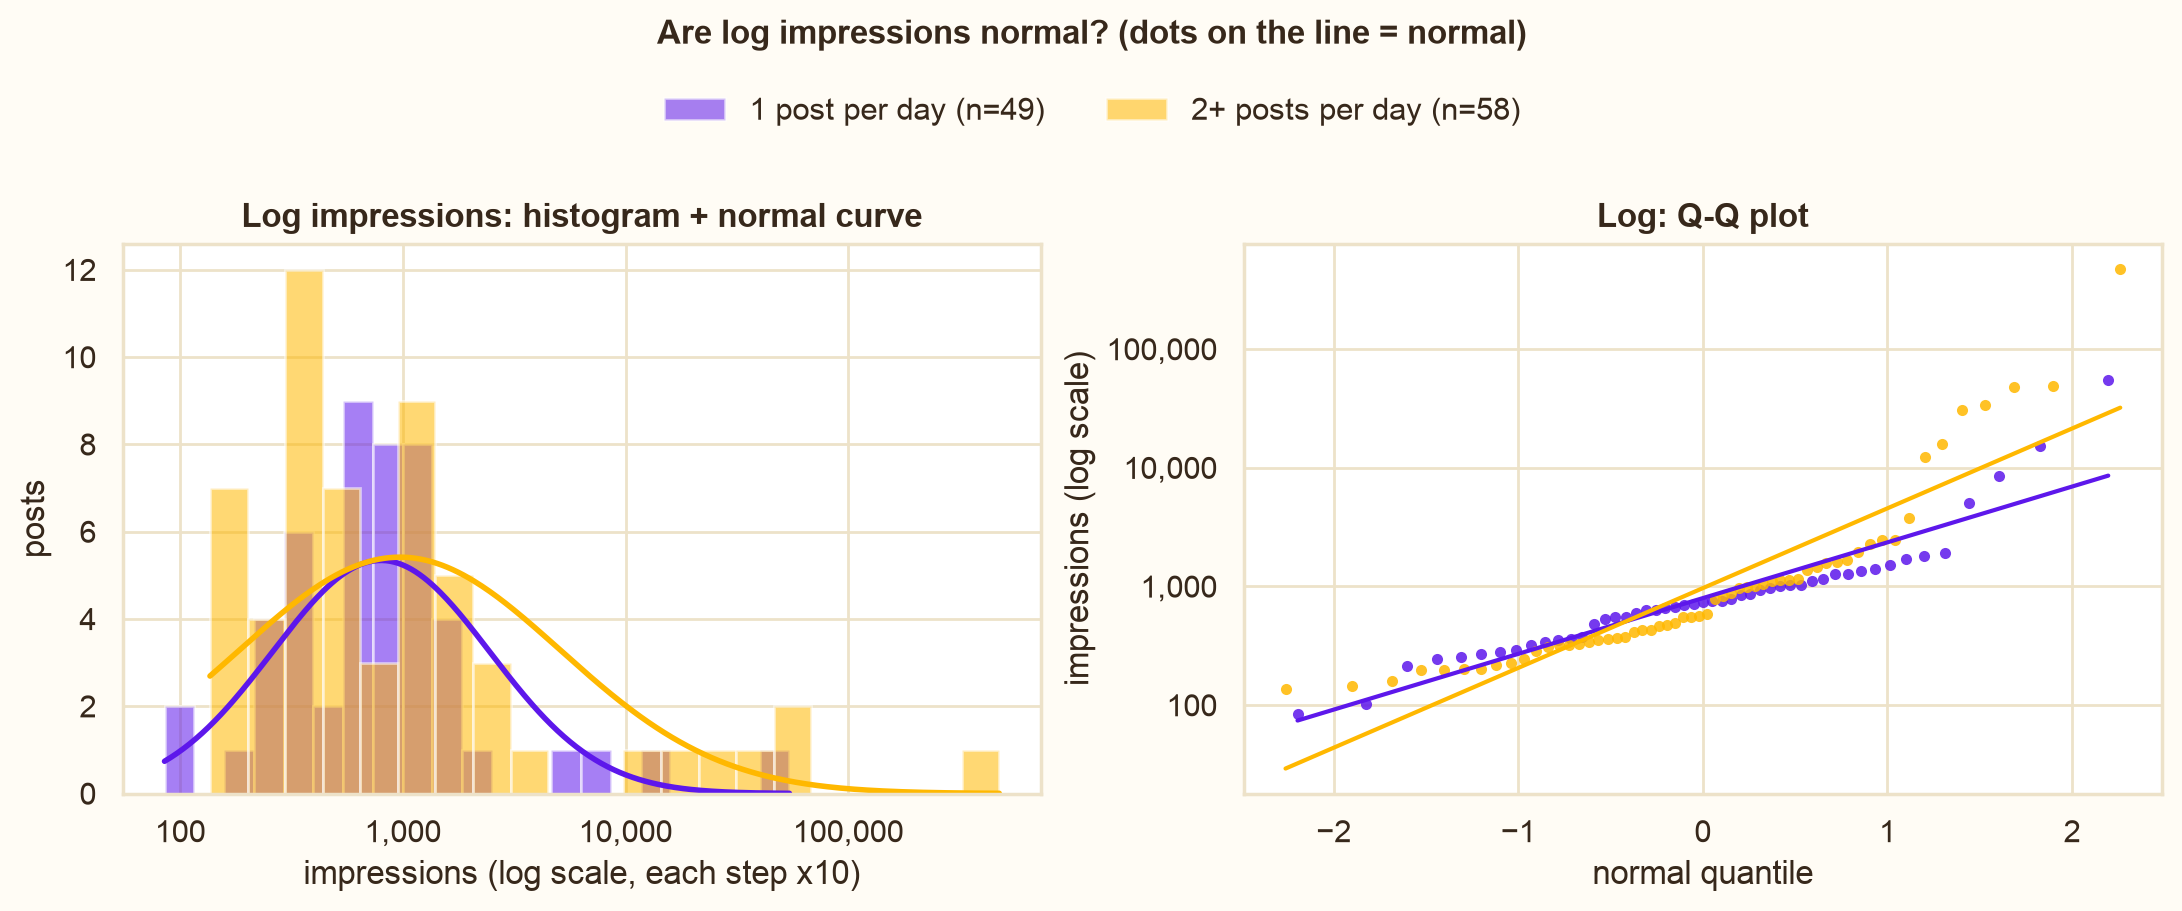
Impressions
- Shapiro-Wilk (W): testing for normality
- Log: 1 post: W = 0.89, 2+ posts: W = 0.83 (both p < 0.001). Not normal.
- D'Agostino-Pearson (K²): testing for normality, from skew and tails
- Log: 1 post: K² = 22.2, 2+ posts: K² = 27.1 (both p < 0.001). Not normal.
- Skewness: testing for a lopsided shape
- Log: 1 post: 1.34, 2+ posts: 1.65. Still a right tail.
- Excess kurtosis: testing for heavy tails
- Log: 1 post: 3.53, 2+ posts: 2.75. Still heavy tails.
- Q-Q plot: While the middle follows the line, the more 'viral' or 'semi-viral' posts do not. -> Not normal
So we cannot say the data for impressions is normal.
Engagement
- Shapiro-Wilk (W): testing for normality
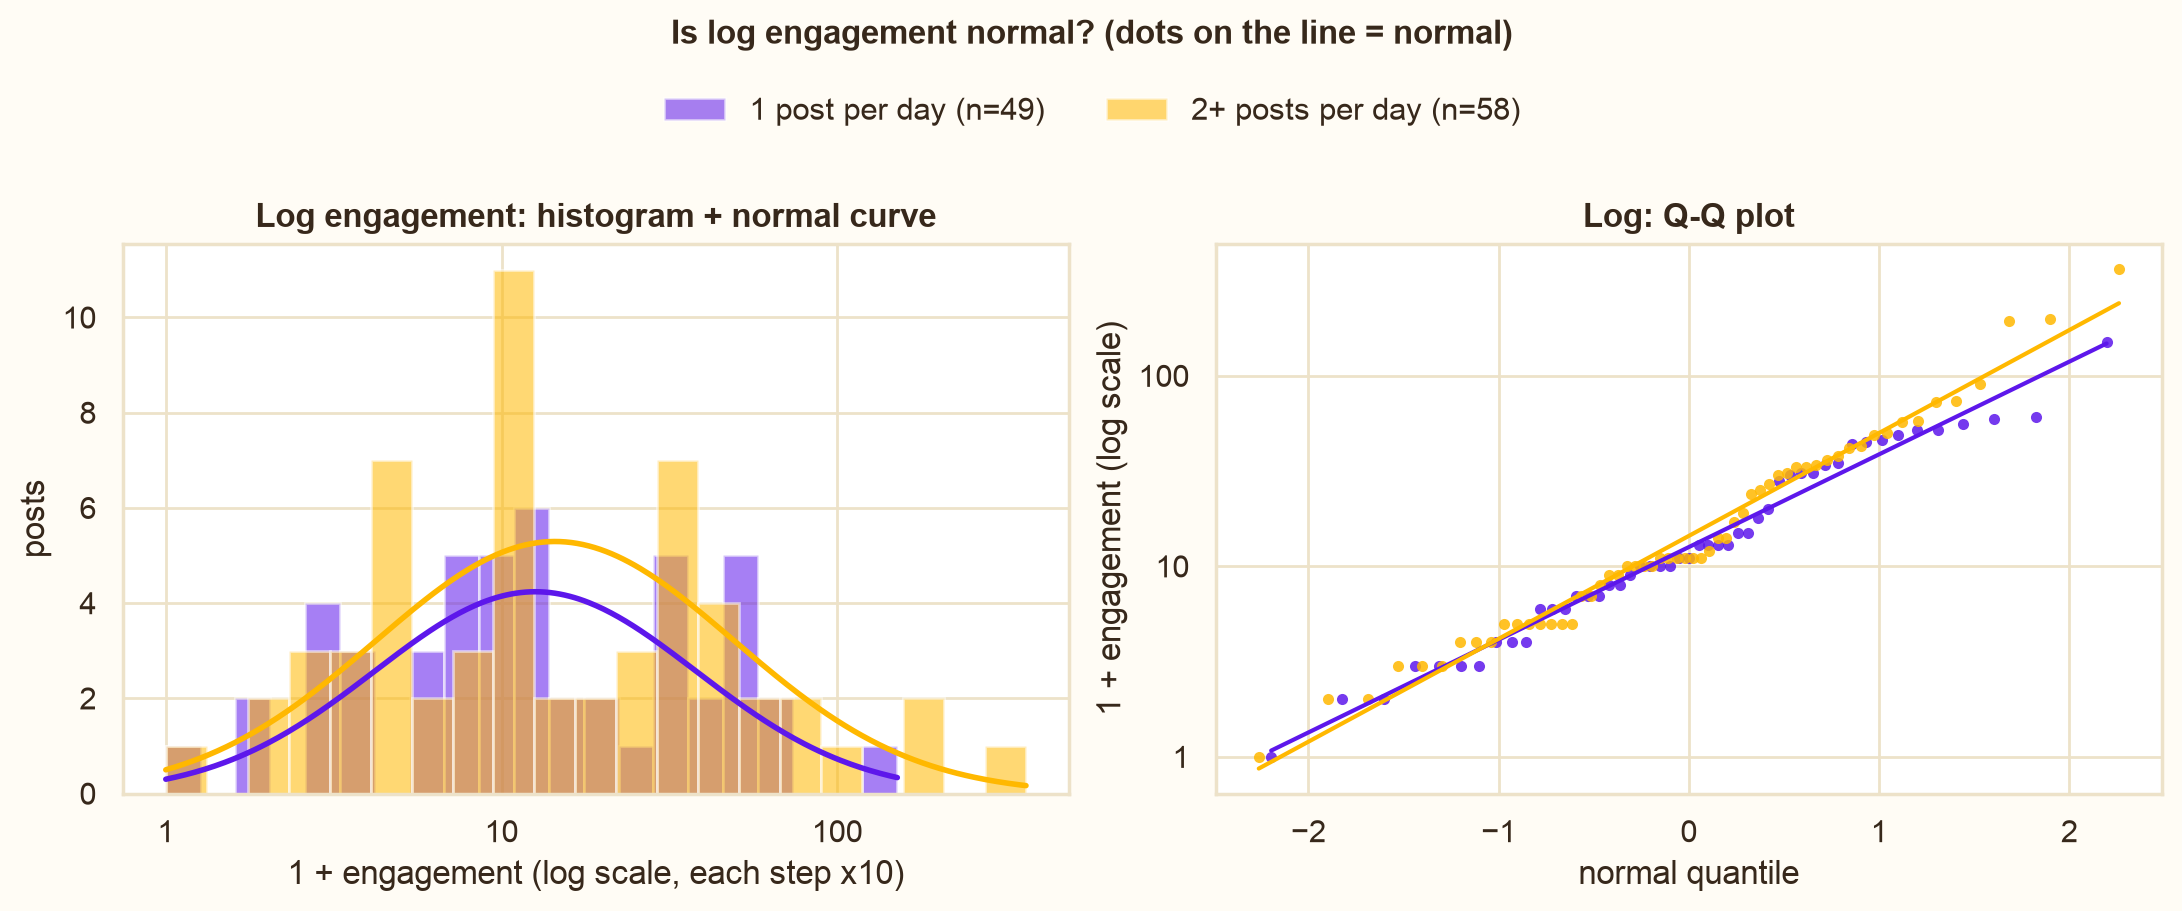
- Log: 1 post: W = 0.98 (p = 0.50), 2+ posts: W = 0.98 (p = 0.42). Normal.
- D'Agostino-Pearson (K²): testing for normality, from skew and tails
- Log: 1 post: K² = 0.7 (p = 0.70), 2+ posts: K² = 1.5 (p = 0.47). Normal.
- Skewness: testing for a lopsided shape
- Log: 1 post: −0.03, 2+ posts: 0.36. Roughly symmetric.
- Excess kurtosis: testing for heavy tails
- Log: 1 post: −0.60, 2+ posts: −0.15. Normal tails.
- Q-Q plot: the dots follow the line. Normal.
Engagement data is normal.
2b. Equal spread (on the log scale)
We use Brown-Forsythe to test the spread as we have skewed data (as opposed to Levene), which compares medians as opposed to means.
Impressions
- Brown-Forsythe (F): testing for equal spread
- Log: F = 3.44, p = 0.067. Not significantly different (borderline).
- Standard deviation (SD): how spread out each group is
- Log: 1 post: 1.13, 2+ posts: 1.66. 2+ posts is a bit more spread out.
It is borderline, but we can treat the spread as similar.
Engagement
- Brown-Forsythe (F): testing for equal spread
- Log: F = 0.33, p = 0.57. Not different.
- Standard deviation (SD): how spread out each group is
- Log: 1 post: 1.10, 2+ posts: 1.23. About the same.
The spread of engagement is similar.
2c. Independence
We check to see if there is any difference in the groups over time (eg if Jul looks different to Sept) and on different days.
Impressions
- Intraclass correlation (ICC):
- Log: ICC = −0.16, F(23, 34) = 0.66, p = 0.85. Not alike.
- Spearman's rho: testing for a trend over time
- Log: rho = −0.09, p = 0.35. No trend.
Impressions are independent.
Engagement
- Intraclass correlation (ICC):
- Log: ICC = −0.11, F(23, 34) = 0.77, p = 0.75. Not alike.
- Spearman's rho: testing for a trend over time
- Log: rho = −0.22, p = 0.026. A small downward drift.
A slight downwards trend.
2d. Outliers
The outliers are the posts that did better than others - by virtue of social media, viral posts can skew the data a lot.
Impressions
- Tukey's rule:
- Log: 1 post: 3 outliers, 2+ posts: 5 outliers.
By nature of social media and that I have many posts which did not perform well, I have a few outliers. We will test this later.
Engagement
- Tukey's rule:
- 1 post: 0 outliers, 2+ posts: 0 outliers.
No outliers.
Which test, and why
For engagement we can use Welch's two-sample t-test. For impressions we use Mann-Whitney's U test.
So... does posting more than once a day actually impact posting on LinkedIn?
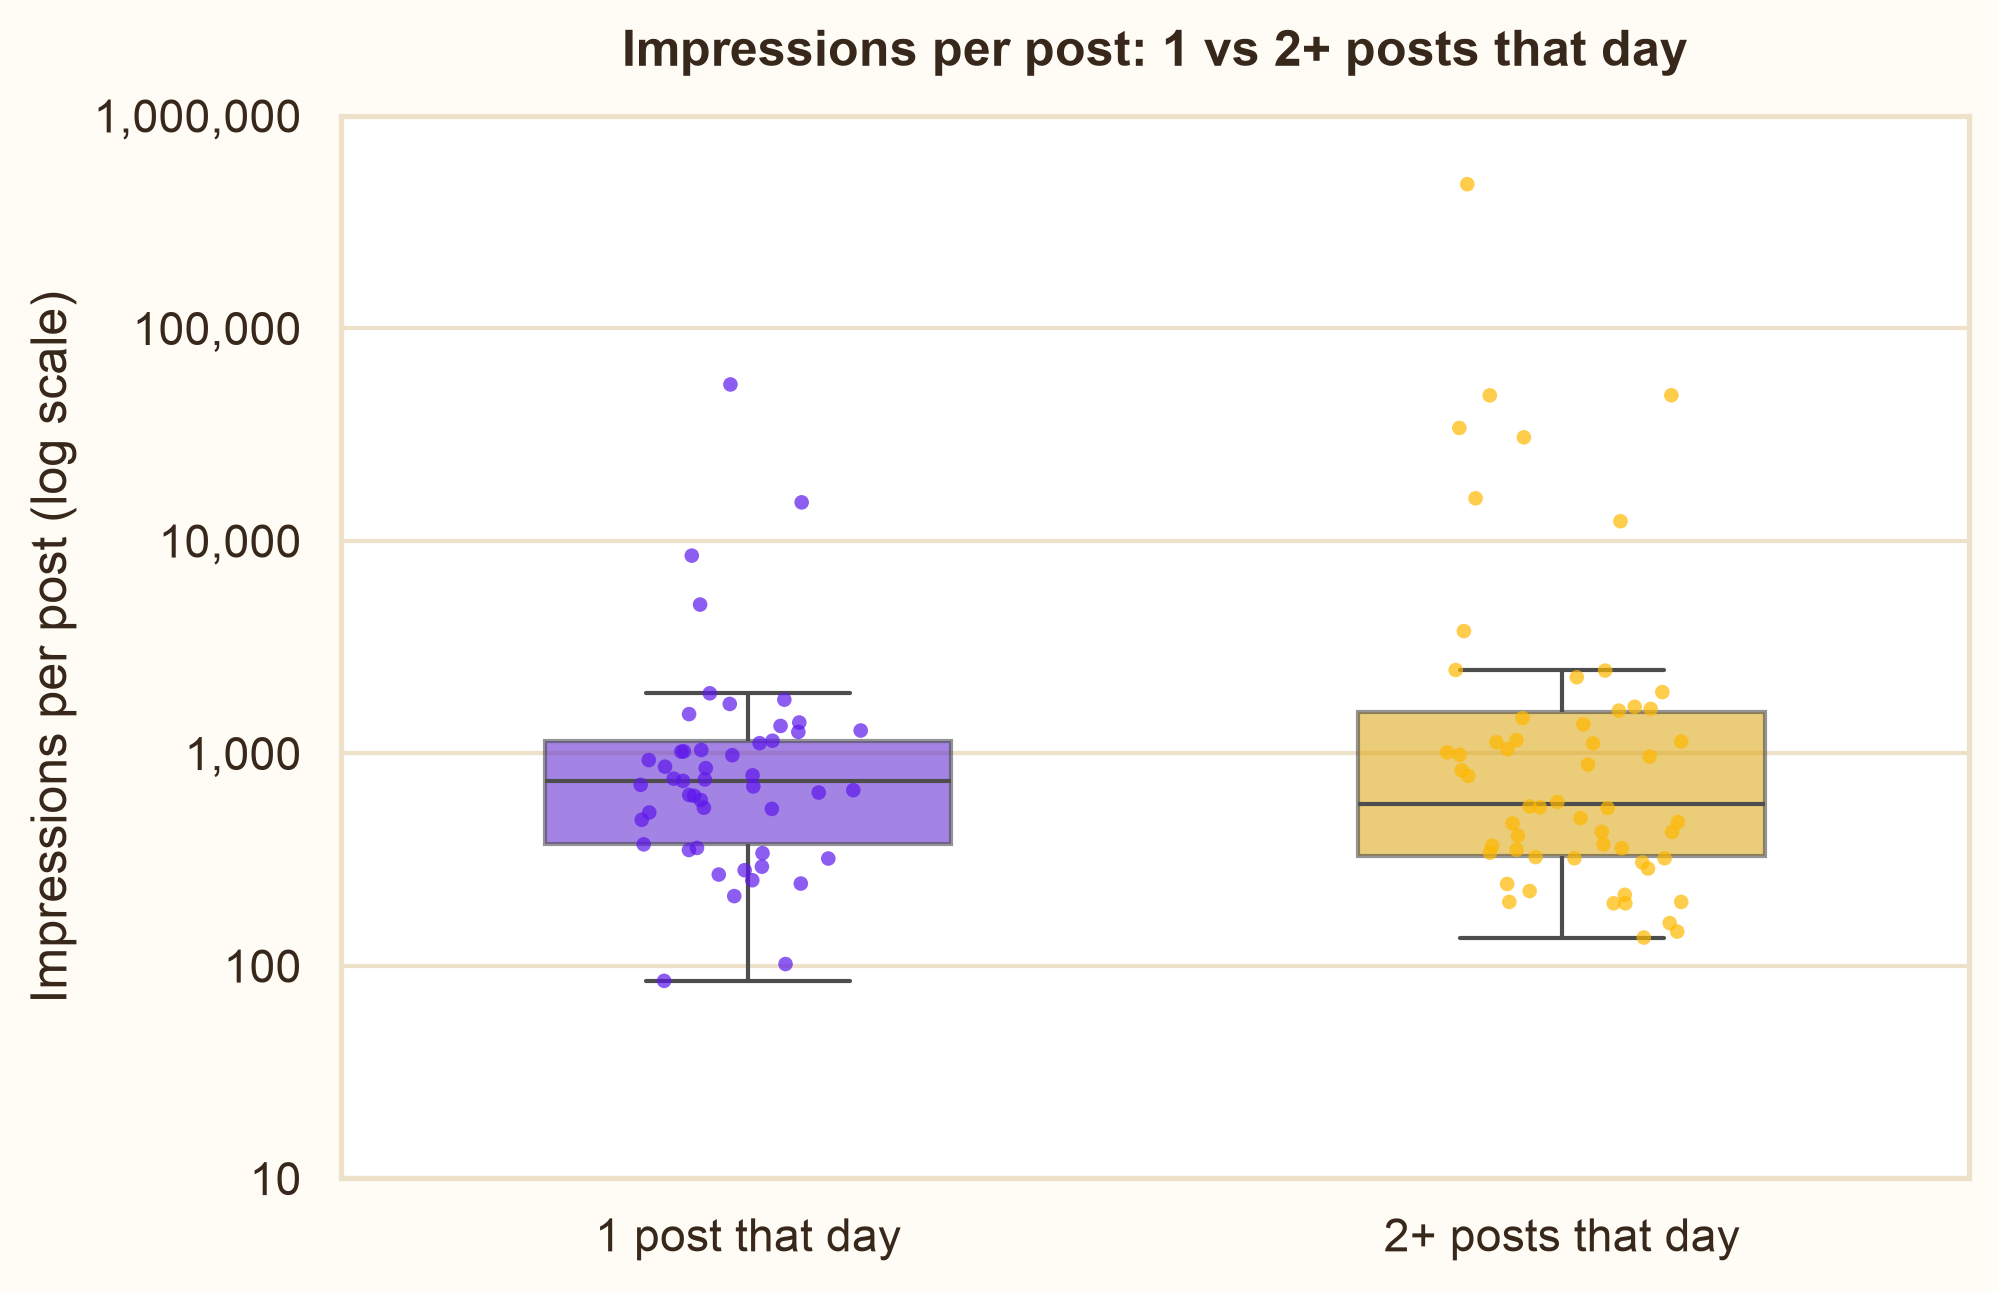
There is no difference for impressions.
Remember this is using a log axis (so each bar is a 10x jump not a 1x jump). We can see that for impressions, there is really no difference in my data. There is no statistical difference here (check the stats for nerds section if interested in the actual numbers).
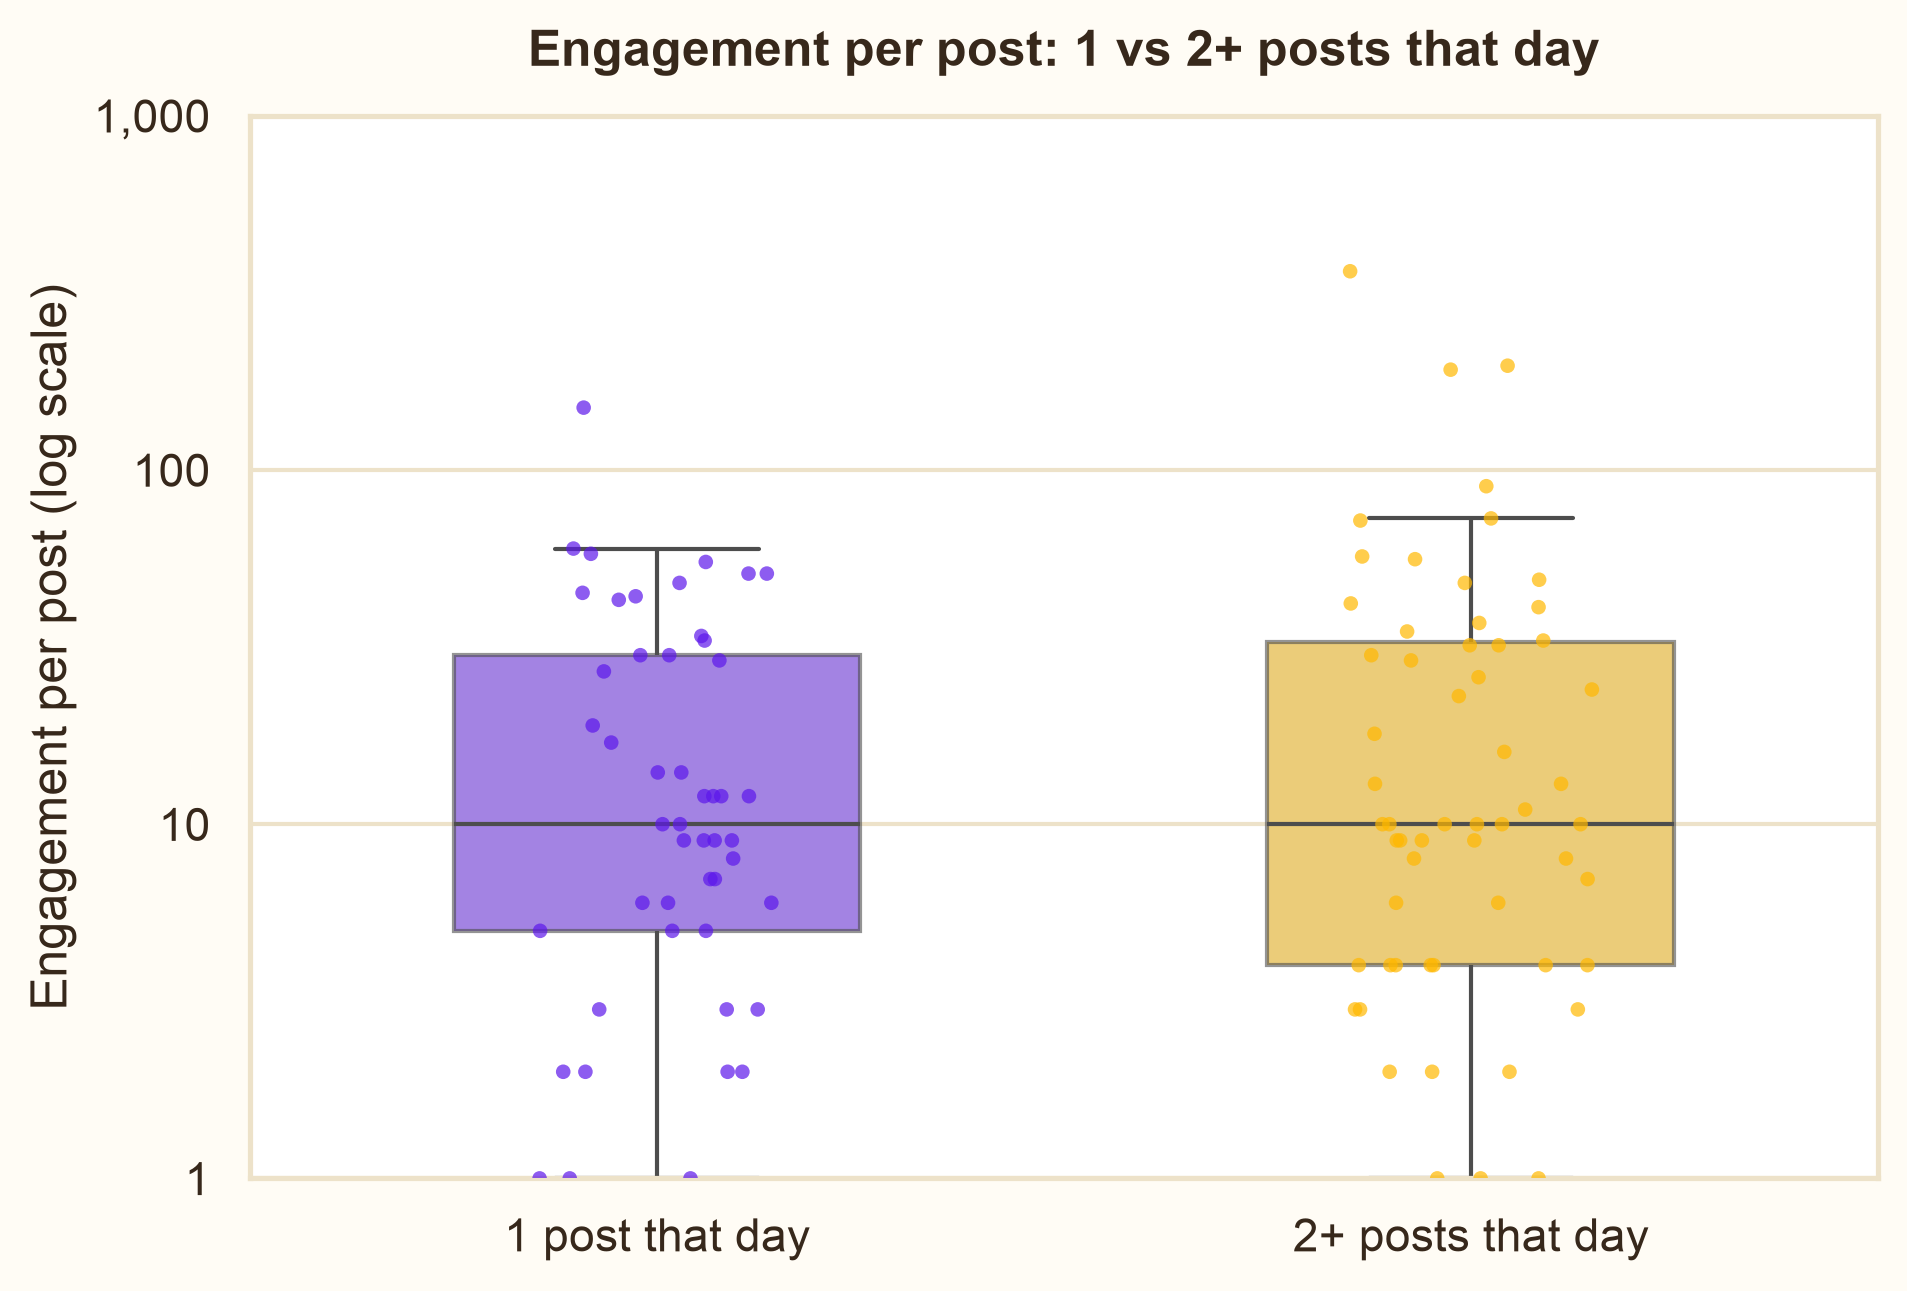
Similarly we can see there is no difference in engagement for my data too.
For the stats nerds like me ❤️ (cause you can't trust AI with these things) ~ Results
We decide at a 5% level of significance.
As we have outliers with impressions, I ran the Mann-Whitney U test both with and without the outliers included.
Mann-Whitney U test: Impressions
  H1: 2+ posts per day < 1 post per day (one-sided)
  n (1 post) = 49, n (2+ posts) = 58
  median (1 post) = 742, median (2+ posts) = 577
  U = 1394.5, z = -0.17, p (one-sided) = 0.435
  rank-biserial r = -0.02

  -- without the 24 Sep 2026 post (476,728) --
  n (1 post) = 49, n (2+ posts) = 57
  median (1 post) = 742, median (2+ posts) = 563
  U = 1345.5, z = -0.32, p (one-sided) = 0.374
  rank-biserial r = -0.04
p with = 0.435
p without = 0.374
Therefore we reject the alternative hypothesis for impressions. There is no difference in impressions if I post 1 or 2+ times a day.
We run Welch's two-sample t-test for engagement.
Welch two-sample t-test: Engagement (natural log of 1 + engagement)
  H1: 2+ posts per day < 1 post per day (one-sided)
  n (1 post) = 49, n (2+ posts) = 58
  mean (1 post) = 2.53, mean (2+ posts) = 2.67
  SD (1 post) = 1.10, SD (2+ posts) = 1.23
  t = 0.60, df = 104.6, p (one-sided) = 0.725
  difference in means = 0.13, 95% CI [-0.31, 0.58]
  Hedges g = 0.11
p = 0.725
Therefore, we reject the alternative hypothesis for engagement. There is no difference in engagement if I post 1 or 2+ times a day.
*** While our data is normal, other creators is not so we also do the Mann-Whitney U test here too so we can compare.
Mann-Whitney U test: Engagement
  H1: 2+ posts per day < 1 post per day (one-sided)
  n (1 post) = 49, n (2+ posts) = 58
  median (1 post) = 10, median (2+ posts) = 10
  U = 1477.5, z = 0.35, p (one-sided) = 0.639
  rank-biserial r = 0.04
p = 0.639
Reject alt hypothesis.
What about other creators?
My data is limited. I only have 3.6k followers and a bit over 100 posts to analyse here. I am also getting posts with 0 likes and 76 views. So I wanted to expand the data a little and see if what I see with my data holds true for others.
I picked 10 other creators who have varying follower numbers (6k-91k). This gave us 1.1k posts to analyse.
I went through their account history and their posts on their activity page (limitation: I cannot see if they deleted posts or their views - only their engagement numbers).
Methods and assumptions (creators)
Filtering:
- I removed any posts less than 7 days old (Linkedin can take a little while to push content out)
- I removed anything older than 5 months old.
Engagement means reactions + comments + reposts (things we can see publicly)
How this was done:
- I divided the posts into 2 groups: 1 post per day (641) and 2+ posts per day (524)
- I only kept creators with at least 5 posts in each group. All 10 creators qualify, with 1,165 posts in total.
- I normalised the data with a natural log
- I checked the statistical assumptions (more hidden below if you are interested)
- I ran the proper statistical tests
For the stats nerds like me ❤️ (cause you can't trust AI with these things) ~ Assumptions
***** DISCLAIMER ***** This section assumes you know statistics - you might find it hard to follow along if you do not know statistics.
Step 1. Hypotheses
Firstly we set up the hypotheses for the experiment. We use a 5% level of significance and we ran one test per creator, on engagement (sum of public statistics).
- H0 (null hypothesis): Posting once or 2+ times a day has no impact on engagement.
- H1: Posting more than once a day lowers engagement.
- We do a one sided test
- α = 0.05.
Step 2. Check the assumptions
We are using Welch's two-sample t-test, so we have to check three assumptions. A) Normality, B) Spread and C) Independence.
If Normality does not hold, we can use Mann-Whitney's U test, where the assumptions are A) Spread B) Independence.
We also check outliers.
Note: Creators A, B, I and J have fewer than 20 posts in one of their groups, so their results are less certain.
2a. Normality
The normality of the data tells us if we can use Welch's t-test or not.
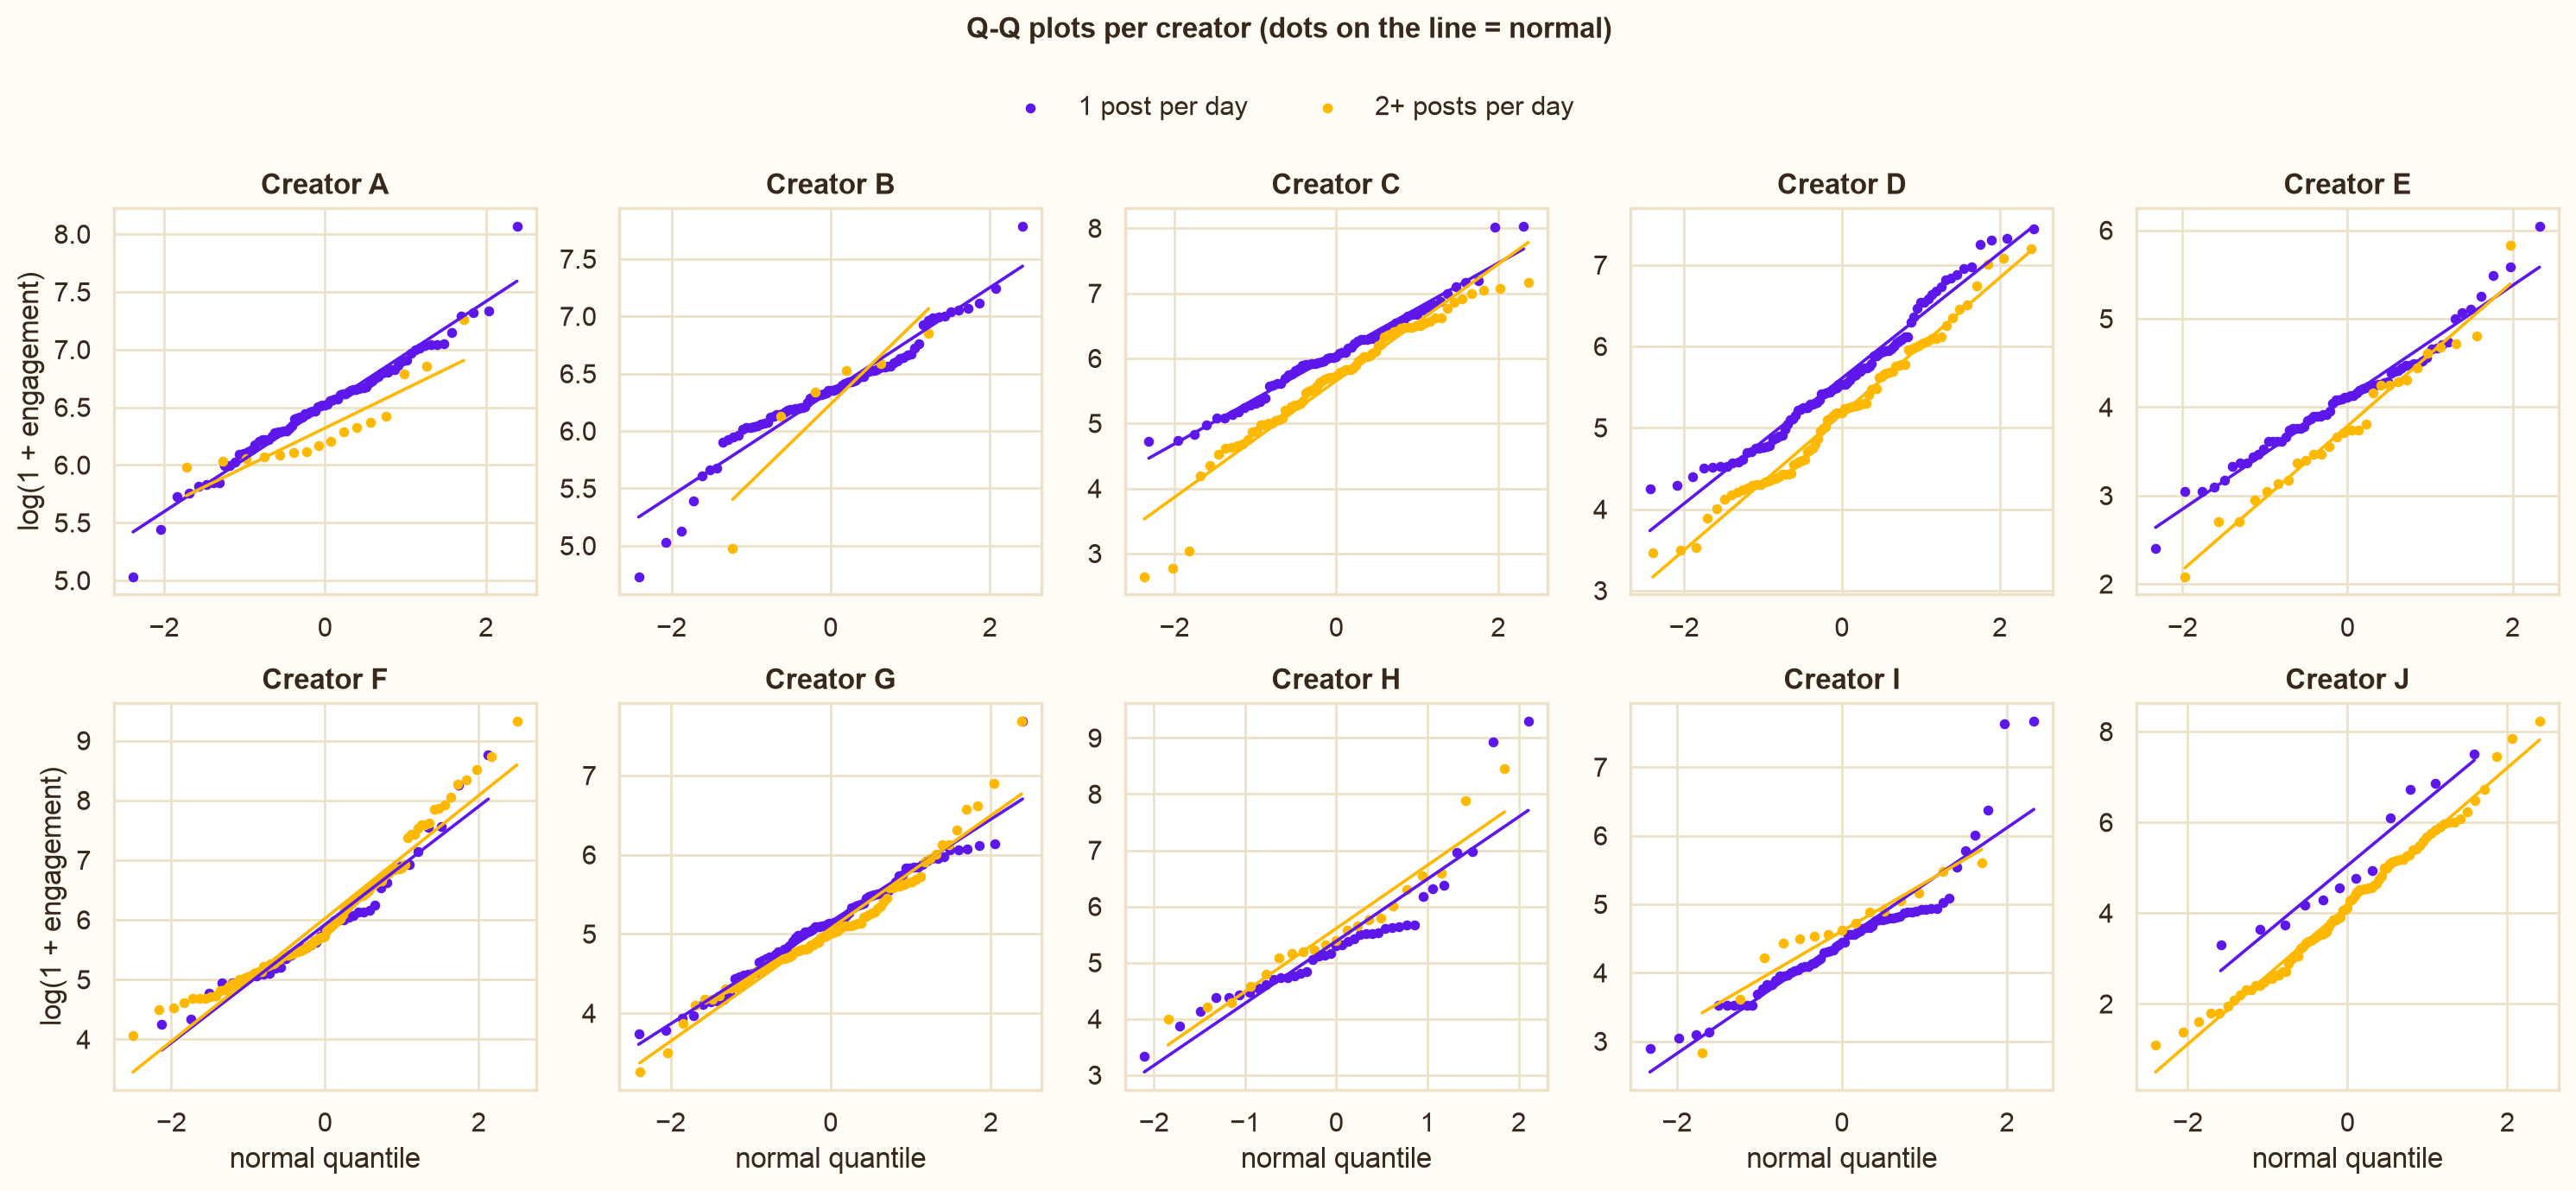
Shapiro-Wilk p-values (p < 0.05 = not normal):
| Creator | 1 post per day | 2+ posts per day | Normal? |
|---|---|---|---|
| A | 0.14 | 0.004 | No |
| B | < 0.001 | 0.11 | No |
| C | 0.25 | < 0.001 | No |
| D | 0.035 | 0.32 | No |
| E | 0.26 | 0.90 | Yes |
| F | 0.049 | < 0.001 | No |
| G | 0.026 | 0.010 | No |
| H | < 0.001 | 0.12 | No |
| I | < 0.001 | 0.16 | No |
| J | 0.22 | 0.56 | Yes |
8/10 of the creators fail the normality test, so we use Mann-Whitney's U test instead.
2b. Equal spread (on the log scale)
We use Brown-Forsythe to test the spread as we have skewed data (as opposed to Levene), which compares medians as opposed to means.
| Creator | Brown-Forsythe F (p) | SD, 1 post / 2+ posts | Equal? |
|---|---|---|---|
| A | 1.28 (0.26) | 0.45 / 0.36 | Yes |
| B | 0.47 (0.50) | 0.46 / 0.66 | Yes |
| C | 3.11 (0.080) | 0.69 / 0.91 | Yes (borderline) |
| D | 0.67 (0.41) | 0.77 / 0.83 | Yes |
| E | 2.25 (0.14) | 0.63 / 0.79 | Yes |
| F | 0.32 (0.58) | 0.99 / 1.04 | Yes |
| G | 0.16 (0.69) | 0.65 / 0.72 | Yes |
| H | 0.01 (0.93) | 1.17 / 1.11 | Yes |
| I | 0.55 (0.46) | 0.86 / 0.70 | Yes |
| J | 0.24 (0.63) | 1.41 / 1.50 | Yes |
2c. Independence
We check to see if there is any difference in the groups over time (eg if Jul looks different to Sept).
| Creator | ICC (p), same day | Spearman's rho (p), over time | Independent? |
|---|---|---|---|
| A | 0.15 (0.34) | −0.29 (0.003) | A downward drift |
| B | −0.59 (0.79) | 0.18 (0.090) | Yes |
| C | 0.11 (0.18) | −0.23 (0.006) | A downward drift |
| D | −0.21 (0.92) | −0.20 (0.009) | A downward drift |
| E | −0.15 (0.73) | 0.15 (0.14) | Yes |
| F | −0.43 (1.00) | −0.06 (0.50) | Yes |
| G | −0.01 (0.53) | 0.09 (0.24) | Yes |
| H | 0.13 (0.31) | 0.02 (0.90) | Yes |
| I | 0.62 (0.027) | 0.16 (0.14) | Same-day posts alike |
| J | −0.20 (0.97) | −0.10 (0.31) | Yes |
2d. Outliers
The outliers are the posts that did better than others - by virtue of social media, viral posts can skew the data a lot.
Tukey's rule, outliers on the log scale:
| Creator | 1 post per day | 2+ posts per day |
|---|---|---|
| A | 3 | 2 |
| B | 6 | 1 |
| C | 2 | 3 |
| D | 1 | 0 |
| E | 4 | 1 |
| F | 2 | 2 |
| G | 1 | 6 |
| H | 2 | 2 |
| I | 3 | 2 |
| J | 0 | 0 |
Most creators have a few outliers. We will do the same as above when we test them.
Which test to use?
We use Mann-Whitney U test for all.
So... does posting more than once a day actually impact the other creators?
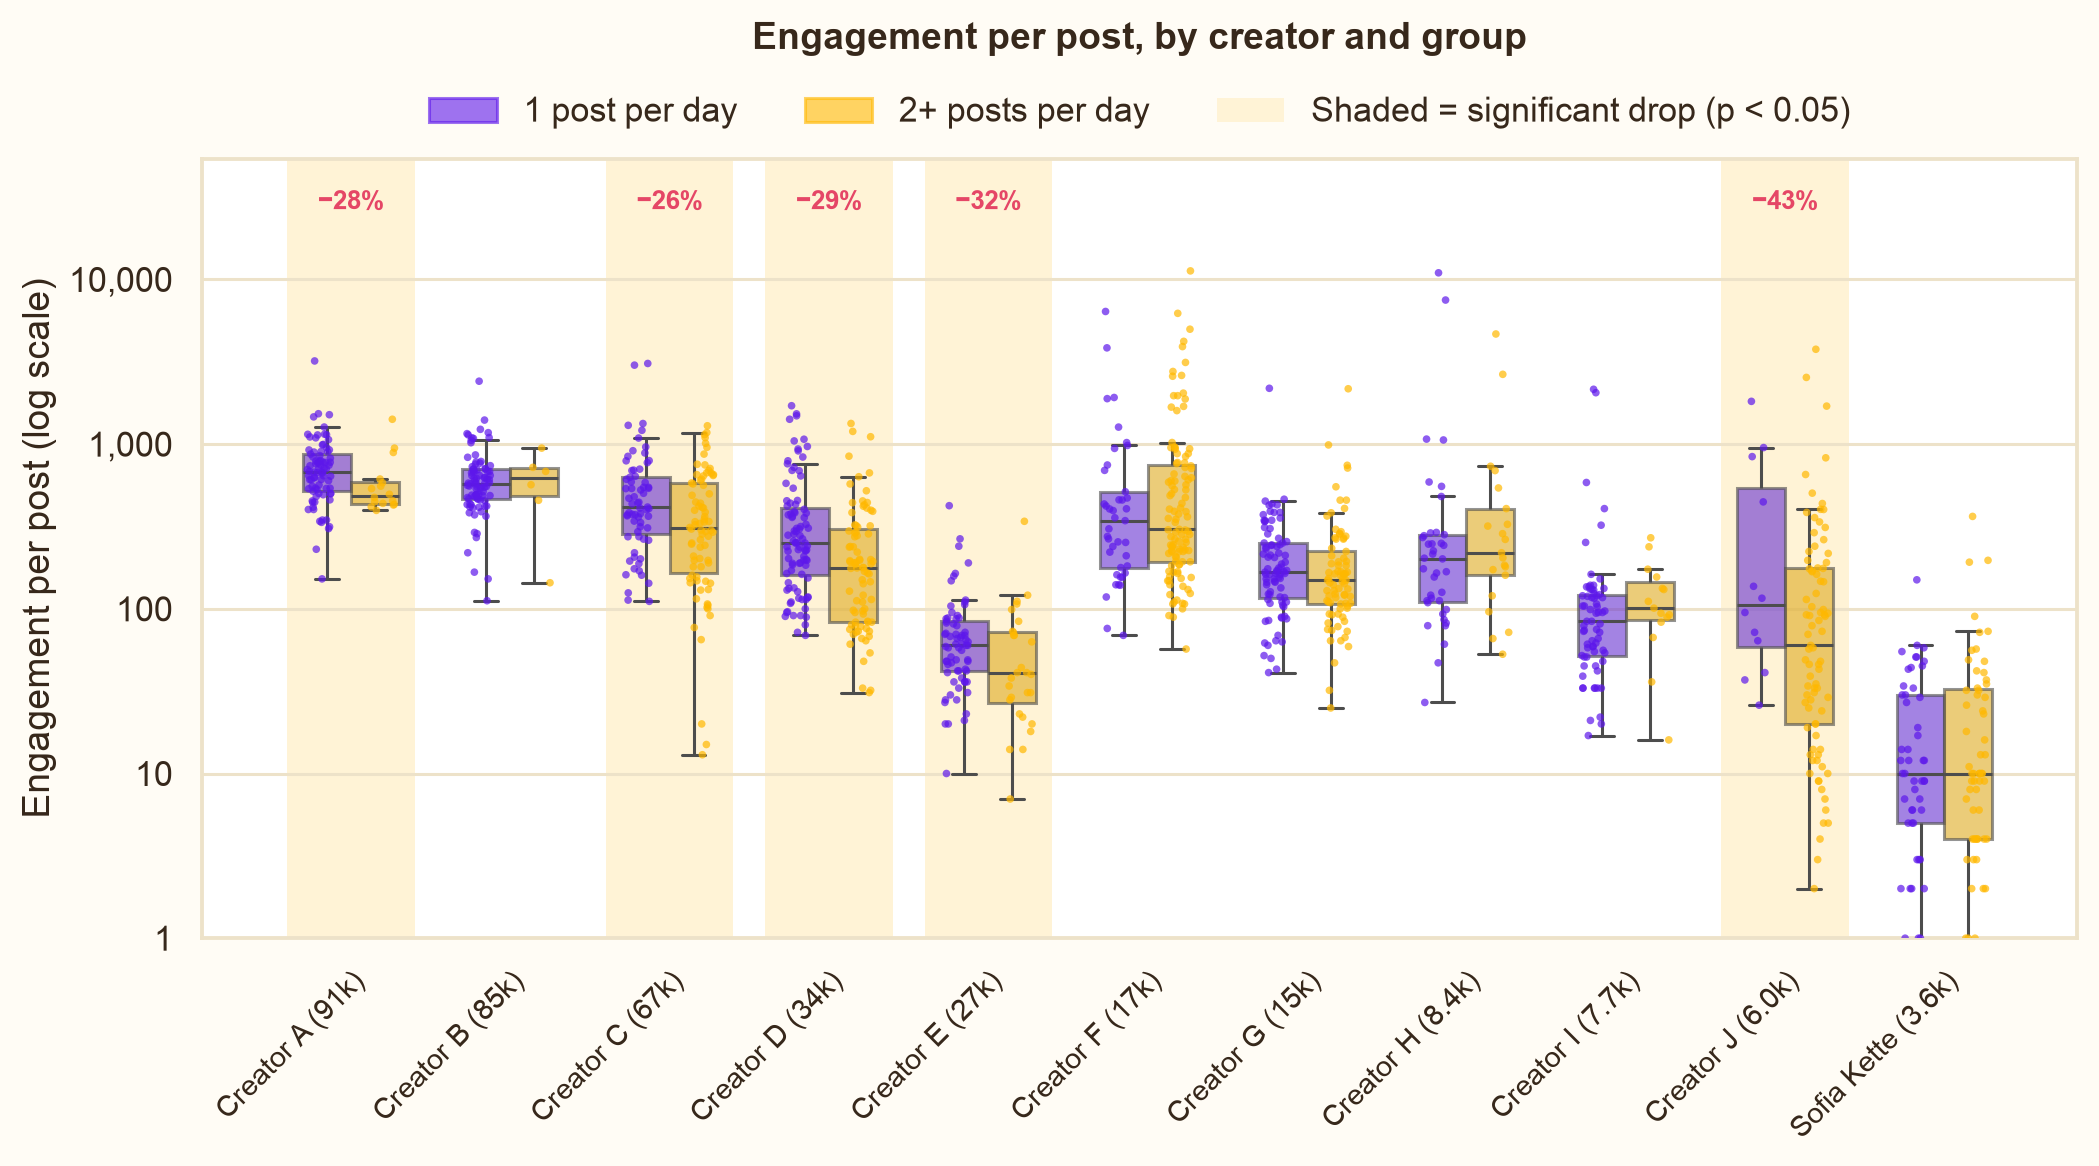
Here I have plotted the two. Again, this is using a log axis (so each bar is a 10x jump not a 1x jump). Remember this is a log scale so the difference between 10 and 100 is the same as 100 ad 1,000 visually.
For some creators, there is no impact with posting more than one a day. With 4 other creators, there is an impact with one getting 43% less engagement on their posts when they post more than one a day (creator J). I also looked at posting up to 5 times a day (you can see the data there too below).
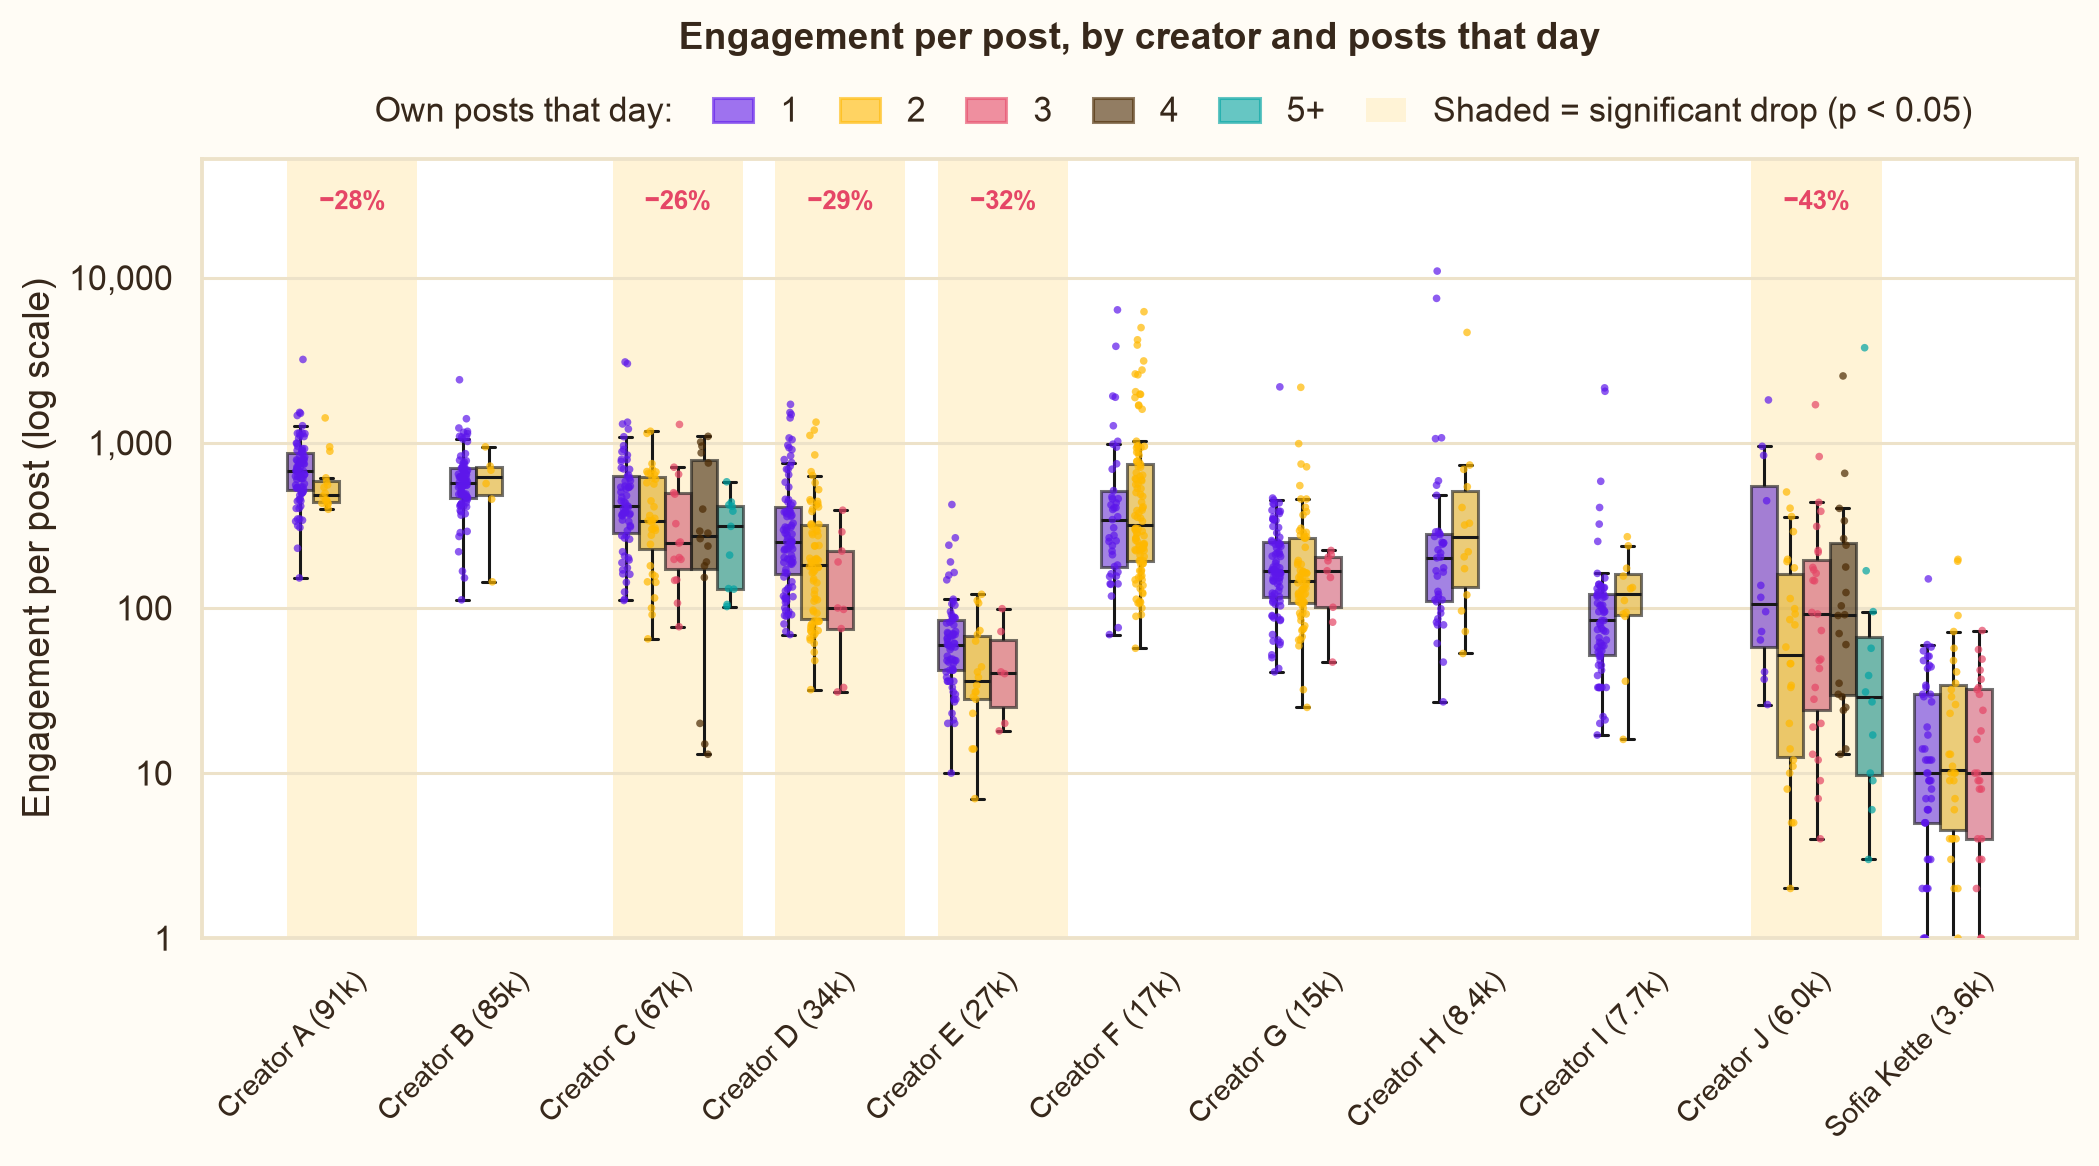
For the stats nerds like me ❤️ (cause you can't trust AI with these things) ~ Results
We decide at a 5% level of significance one sided using Mann-Whitney's U test.
| Creator | Posts on 1-post days | Posts on 2+ post days | Change in engagement | p | Significant drop? |
|---|---|---|---|---|---|
| A | 81 | 16 | −28% | 0.015 | Yes |
| B | 87 | 6 | +9% | 0.547 | No |
| C | 67 | 78 | −26% | 0.004 | Yes |
| D | 92 | 83 | −29% | < 0.001 | Yes |
| E | 69 | 28 | −32% | 0.027 | Yes |
| F | 41 | 111 | −11% | 0.666 | No |
| G | 84 | 81 | −11% | 0.093 | No |
| H | 39 | 21 | +9% | 0.843 | No |
| I | 69 | 15 | +20% | 0.906 | No |
| J | 12 | 85 | −43% | 0.038 | Yes |
As with my data, I also ran the test without the outliers (Tukey's rule, on the log scale):
| Creator | p, with outliers | p, without outliers | Significant drop? |
|---|---|---|---|
| A | 0.015 | 0.001 | Yes, both |
| B | 0.547 | 0.797 | No, both |
| C | 0.004 | 0.022 | Yes, both |
| D | < 0.001 | < 0.001 | Yes, both |
| E | 0.027 | 0.017 | Yes, both |
| F | 0.666 | 0.769 | No, both |
| G | 0.093 | 0.059 | No, both |
| H | 0.843 | 0.802 | No, both |
| I | 0.906 | 0.994 | No, both |
| J | 0.038 | 0.038 | Yes, both (no outliers) |
Removing the outliers doesn't change any result.
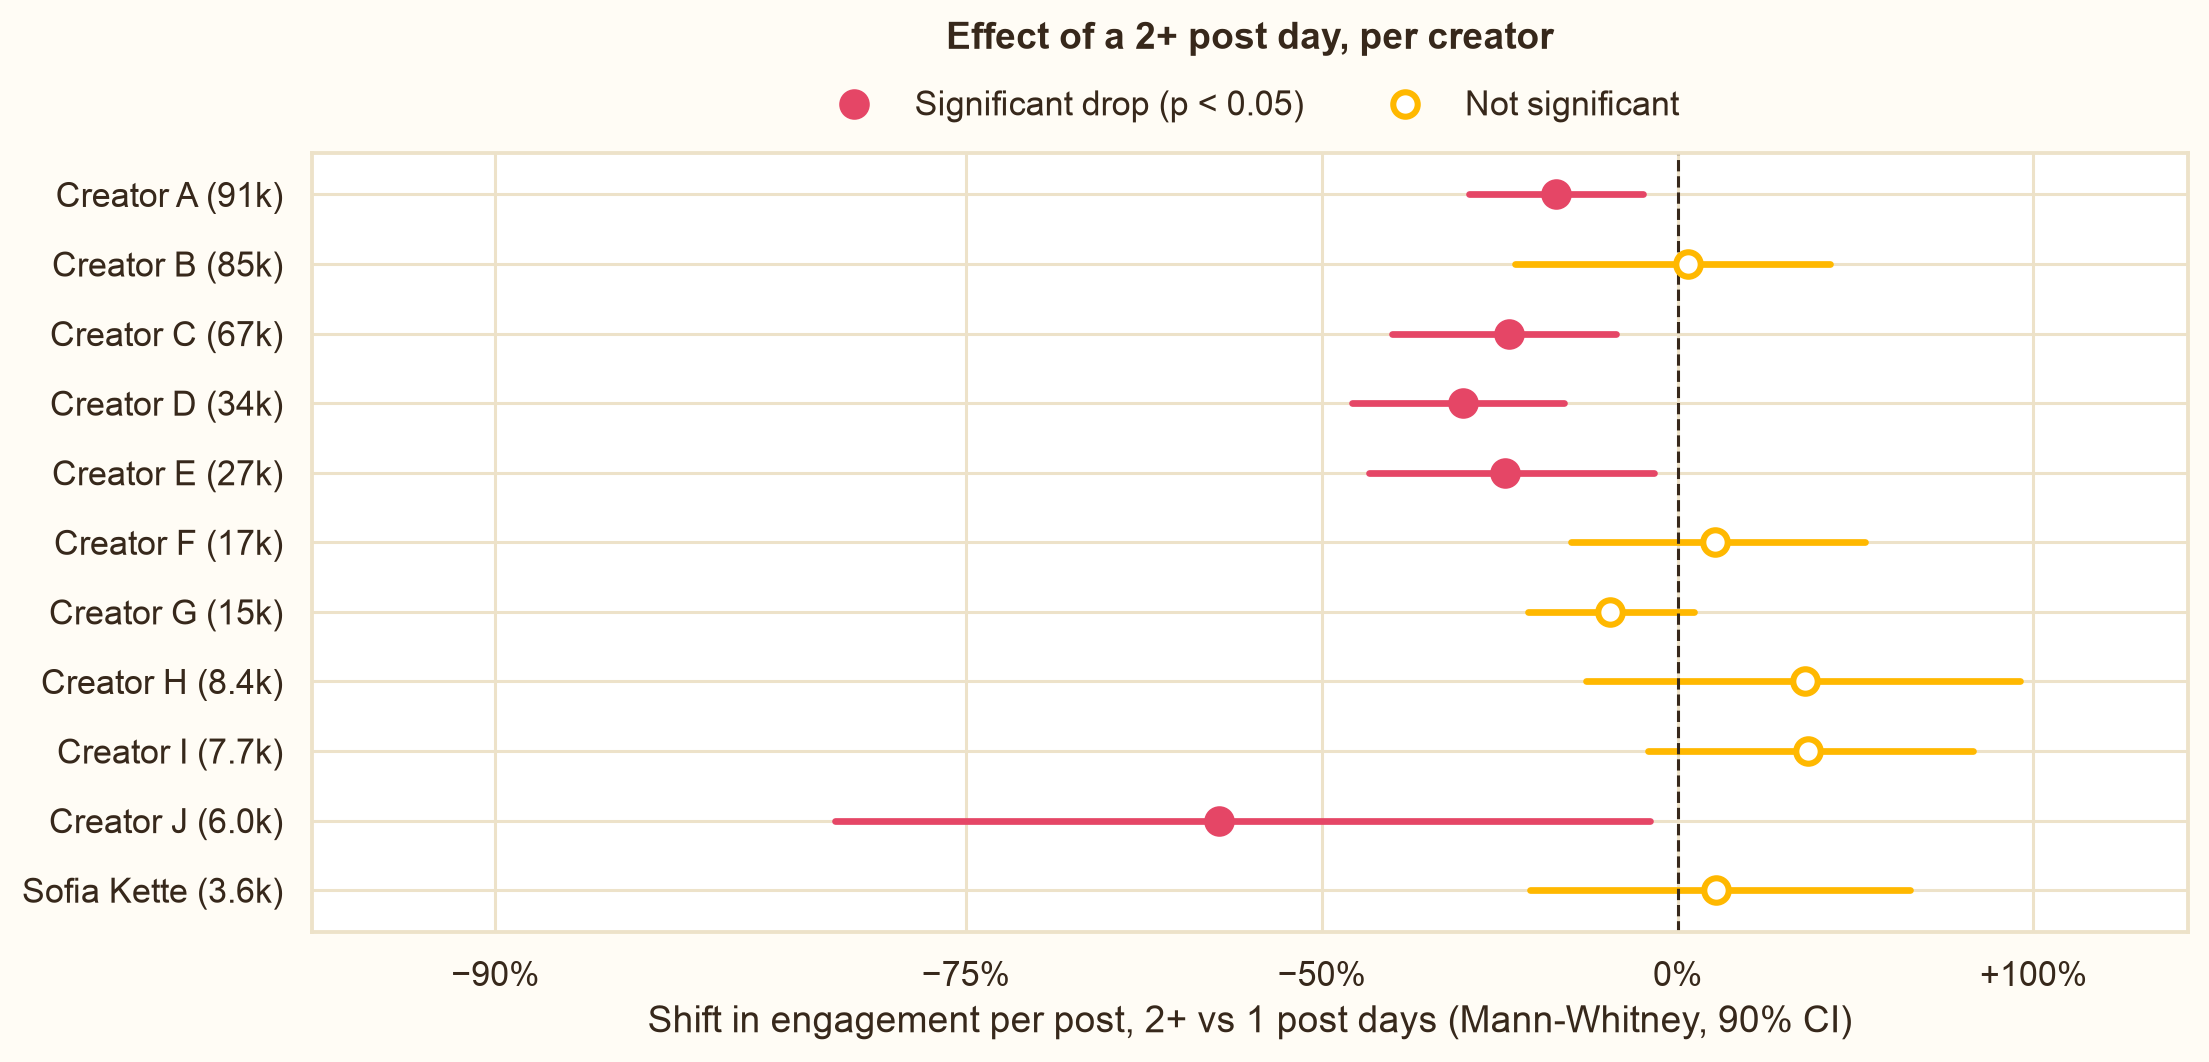
For creators A C D E and J, their engagement dropped between 26% and up to 43% when they posted more than once a day. Therefore we reject H0 for them. The other creators saw no change.
So... its a mix!
Conclusion
So there is not really a proper conclusion here... some creators have no change in engagement if they post more than once a day. Others have up to a 43% drop in engagement. There is a question of whether if someone is posting 5 times a day if they are giving equal thought to the posts they are writing or if they are 'testing' more ideas out there to see what different angles might land.
Creative testing or more low effort posts could easily be the answer and reason. This is not something I have looked into for these creators though (nor would it be my place to judge a 'low effort' post as sometimes what looks low effort actually takes a lot of effort).
I would say though, as long as you are putting effort into each post, posting more than once a day will not harm your engagement (or reach as we saw in my limited data set).
And not to forget... even if your engagement drops by 43%, you are still getting more engagement than you would if you only did one post.
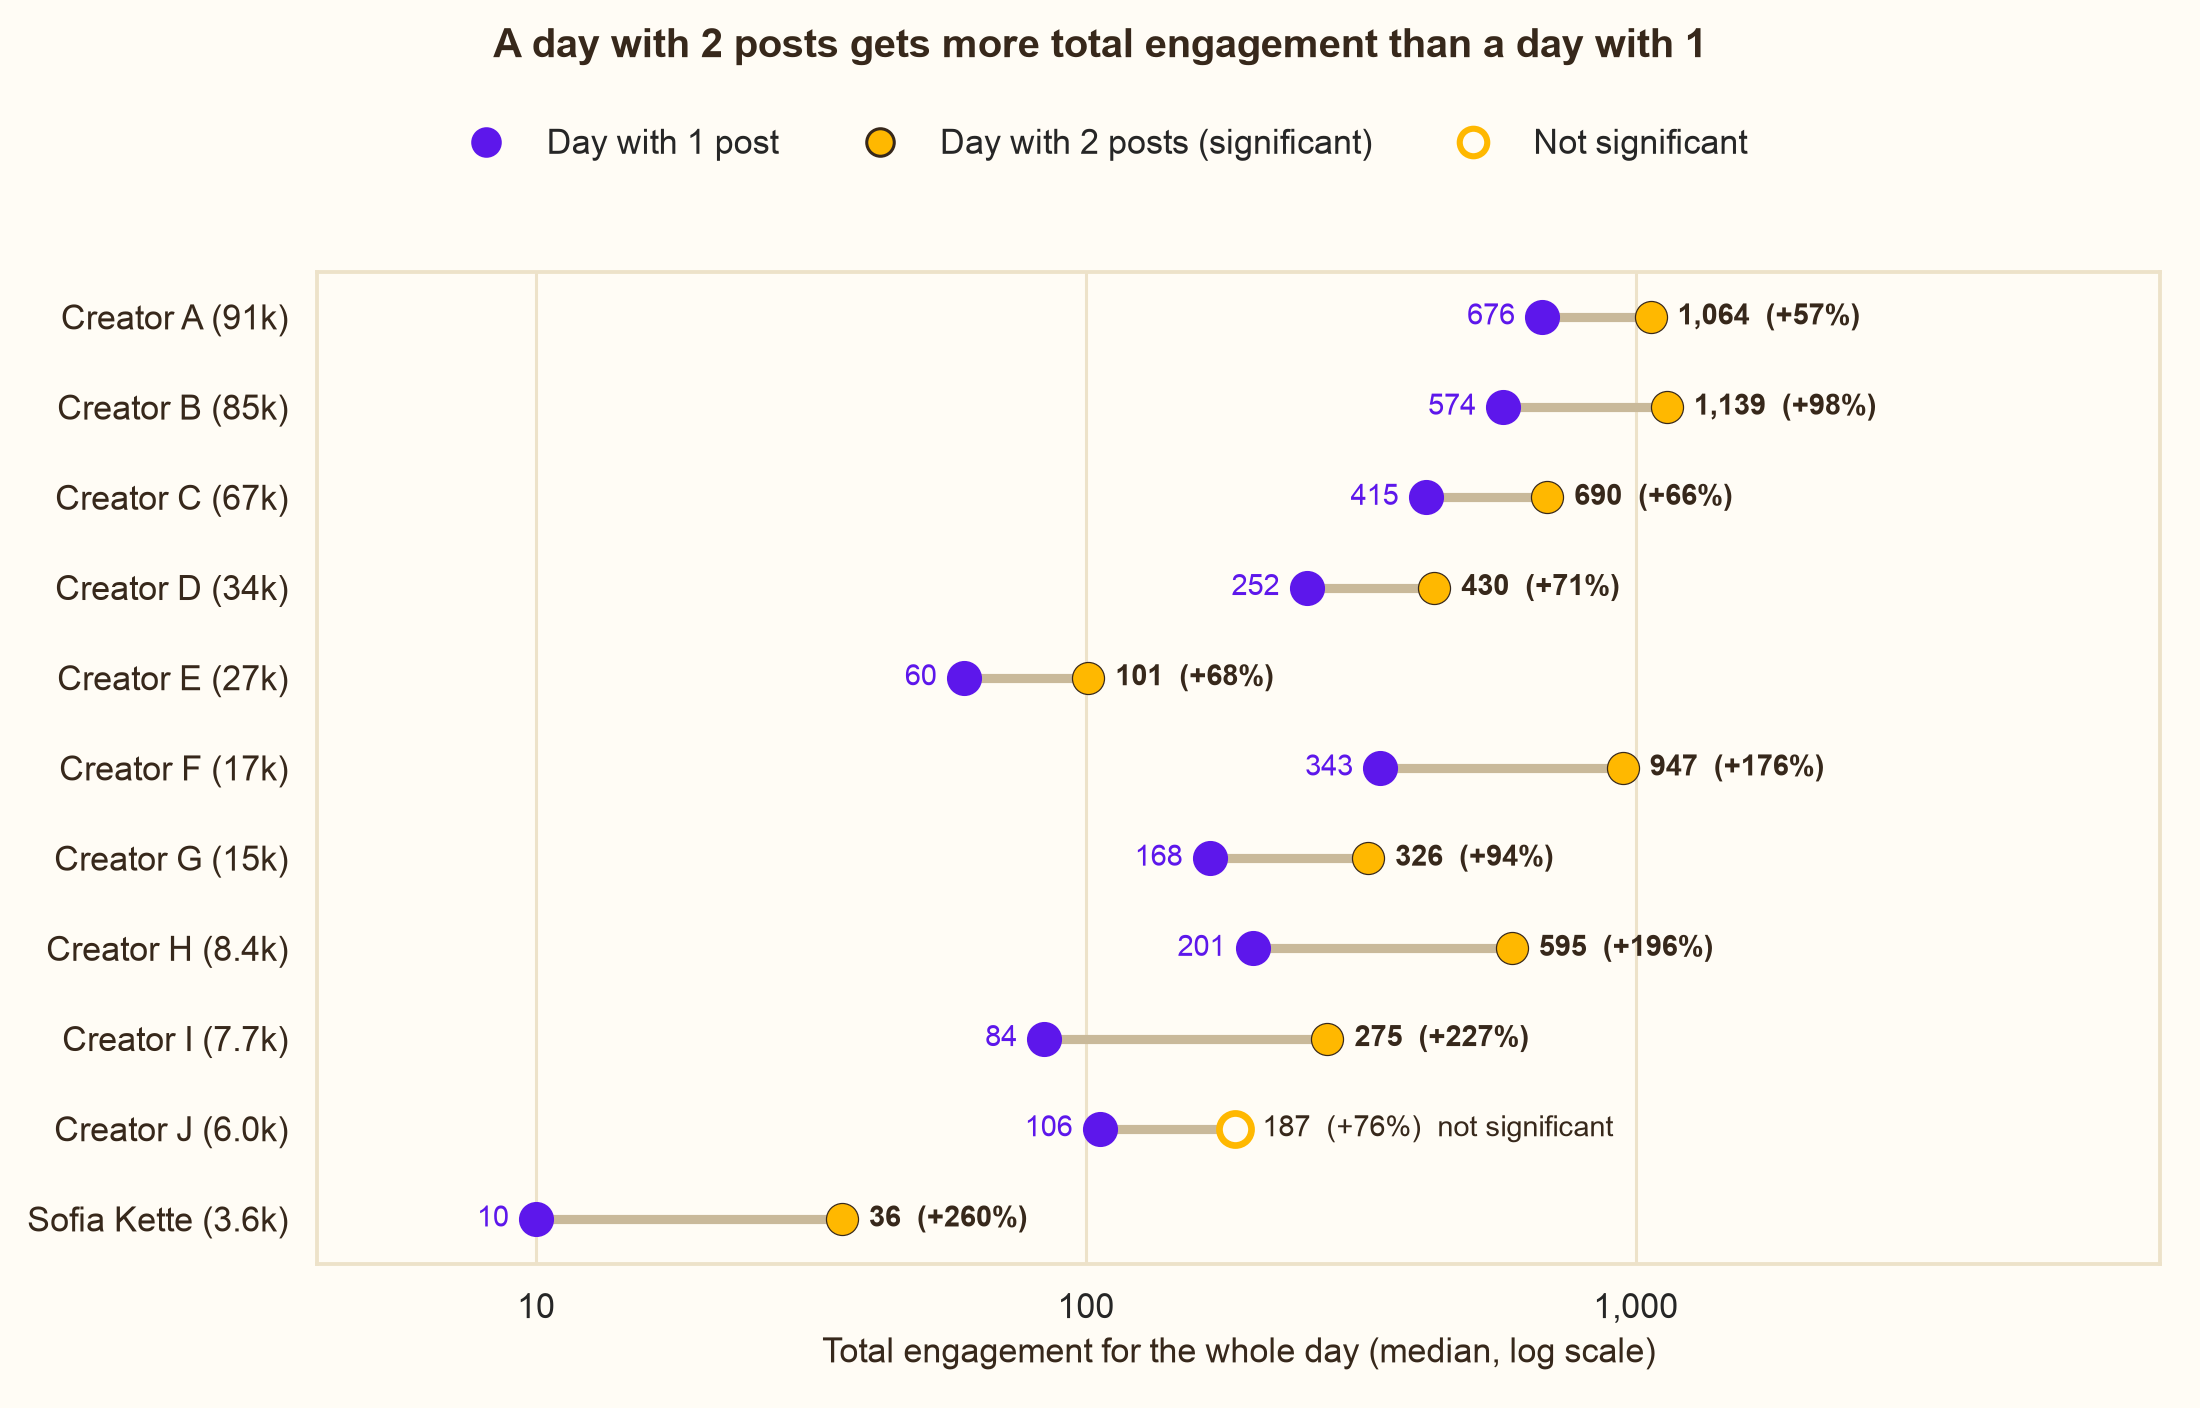
While the evidence isn't rock solid, I think we can conclude this as a "Myth".
Sofia KetteFounder of SoMe, AdelaideLinkedIn